Every drawing, every markup, one map.
Markup Maps is a web app for the office and an iPhone and iPad app for the field, working on the same live map. Here's what each part does, from real projects.
Cryptic CAD layers in. A drawing anyone can read out.
Upload the native CAD and GIS files and every feature lands at its real-world position. Then let AI do the tedious part. It suggests, and you approve.
- AI-assisted coordinate systems. When a file doesn't say where it belongs, AI recommends one from the file's clues, and you confirm it.
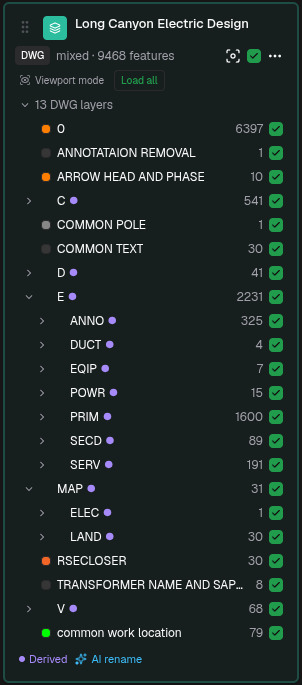
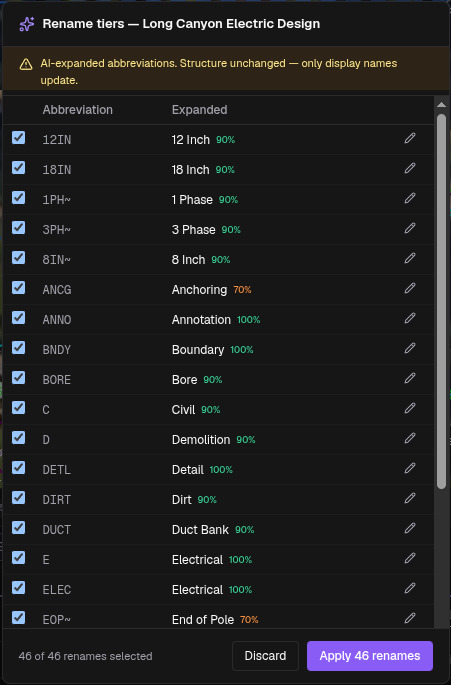
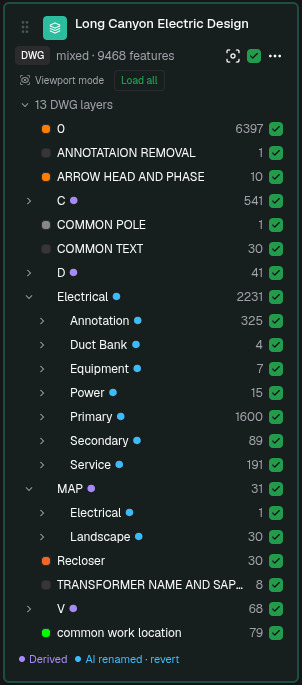
- AI layer names. Abbreviations like DUCT, EQIP and SECD are expanded to Duct Bank, Equipment and Secondary, with a confidence score on each. The structure never changes, only what you read.
- DWG, DXF, shapefile, KML/KMZ, GeoJSON, up to 4 GB per file. Shapefiles without a .prj are refused rather than guessed.
Your team's tools, your team's forms.
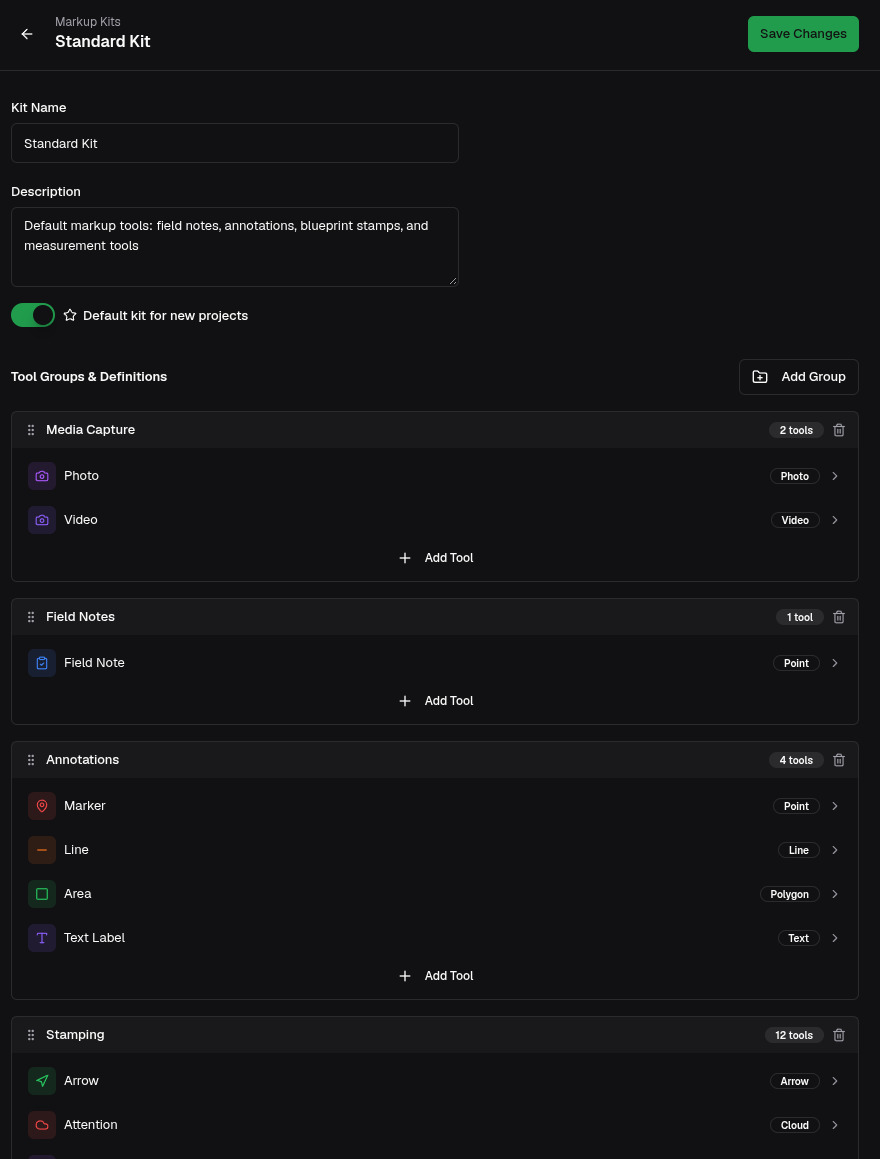
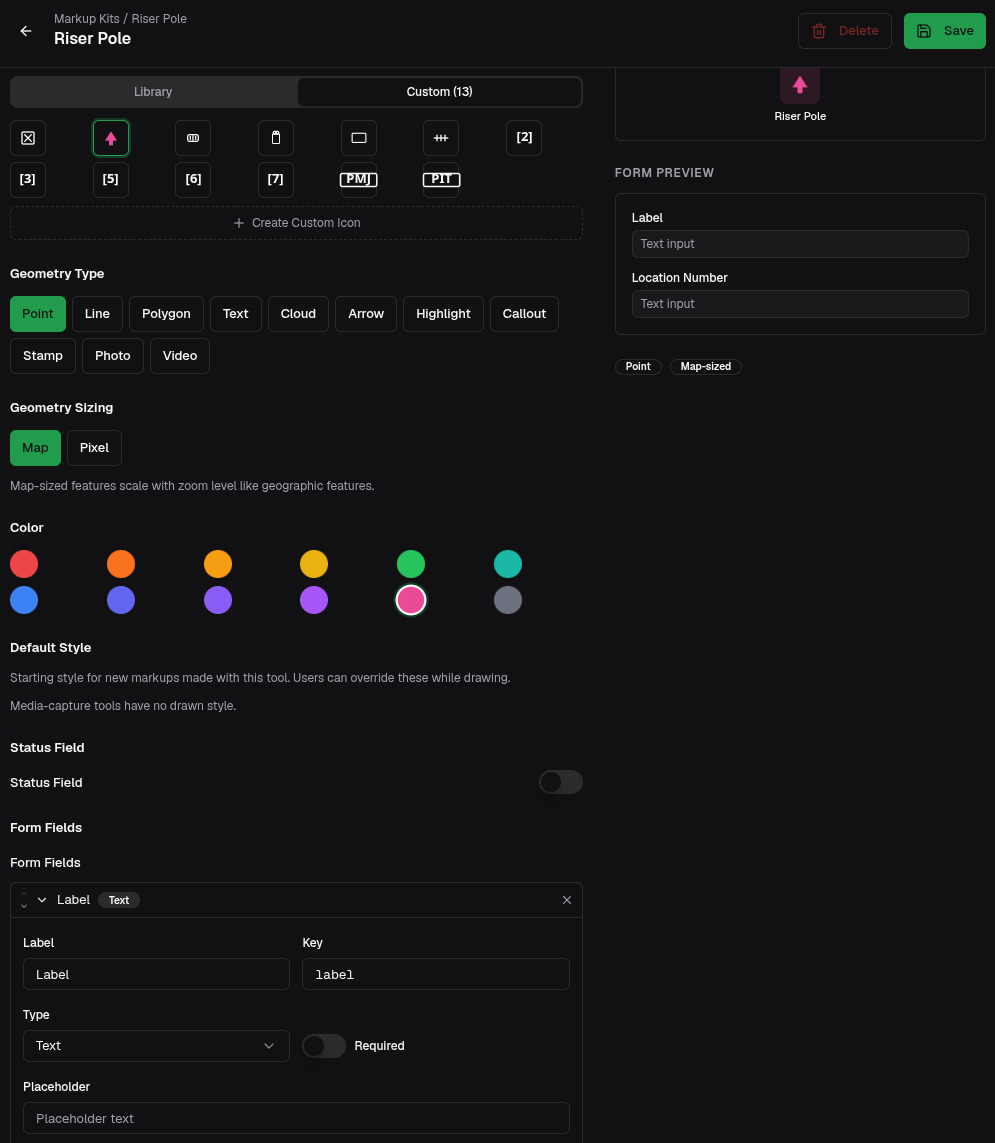
Build a markup kit once for your whole account: the tools your crews use, the form each one asks for, the status fields the office tracks and the icons that show on the map. Every project gets the same kit, on the web and on the phone.
See the site without driving out to it.
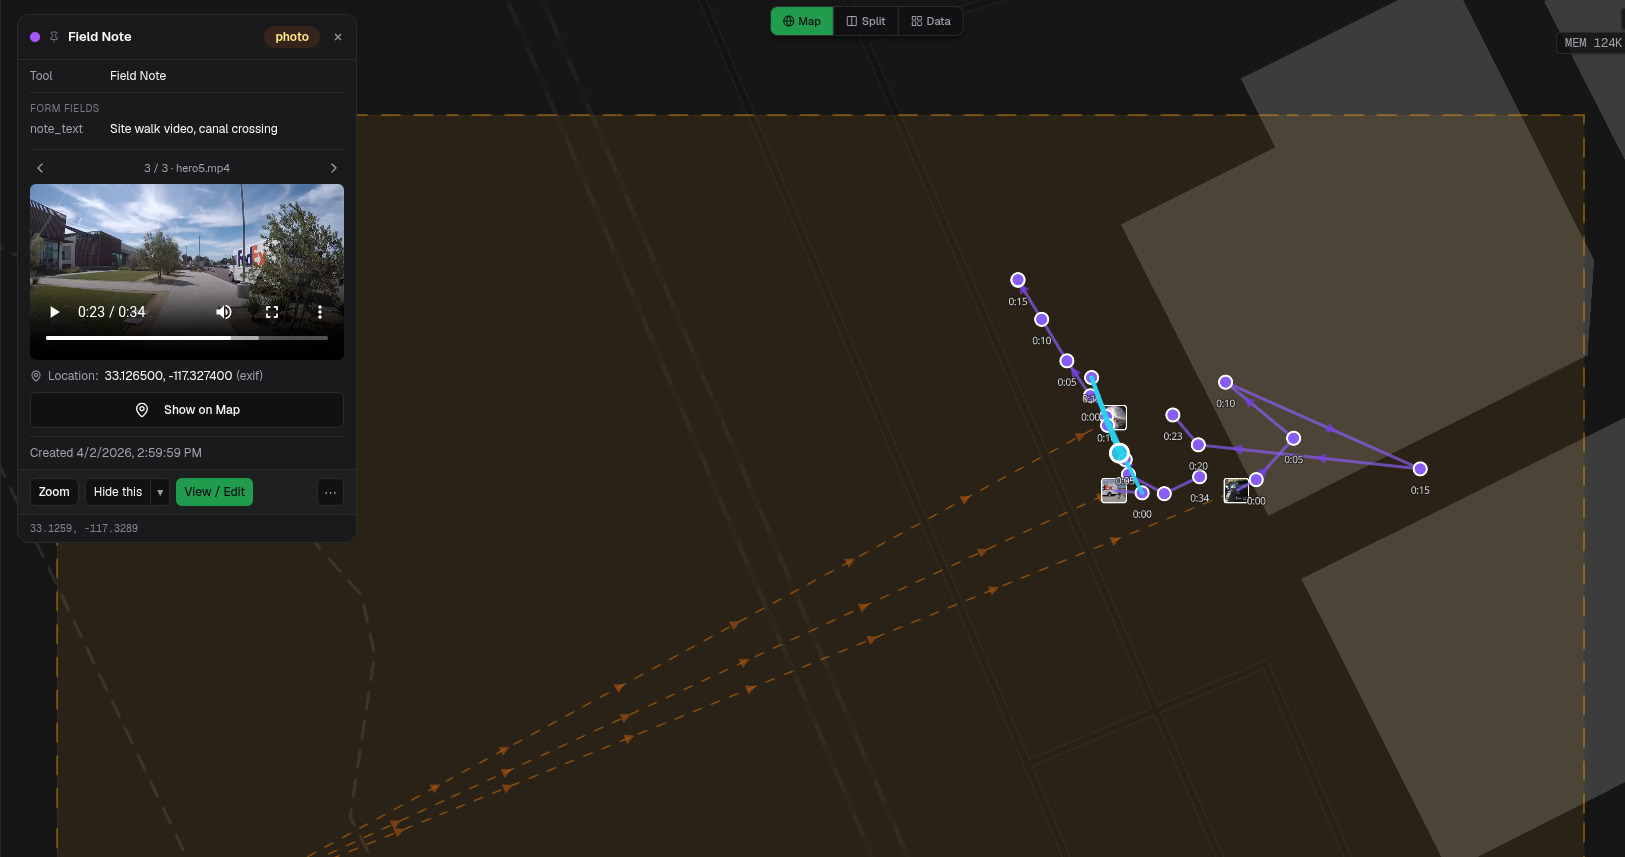
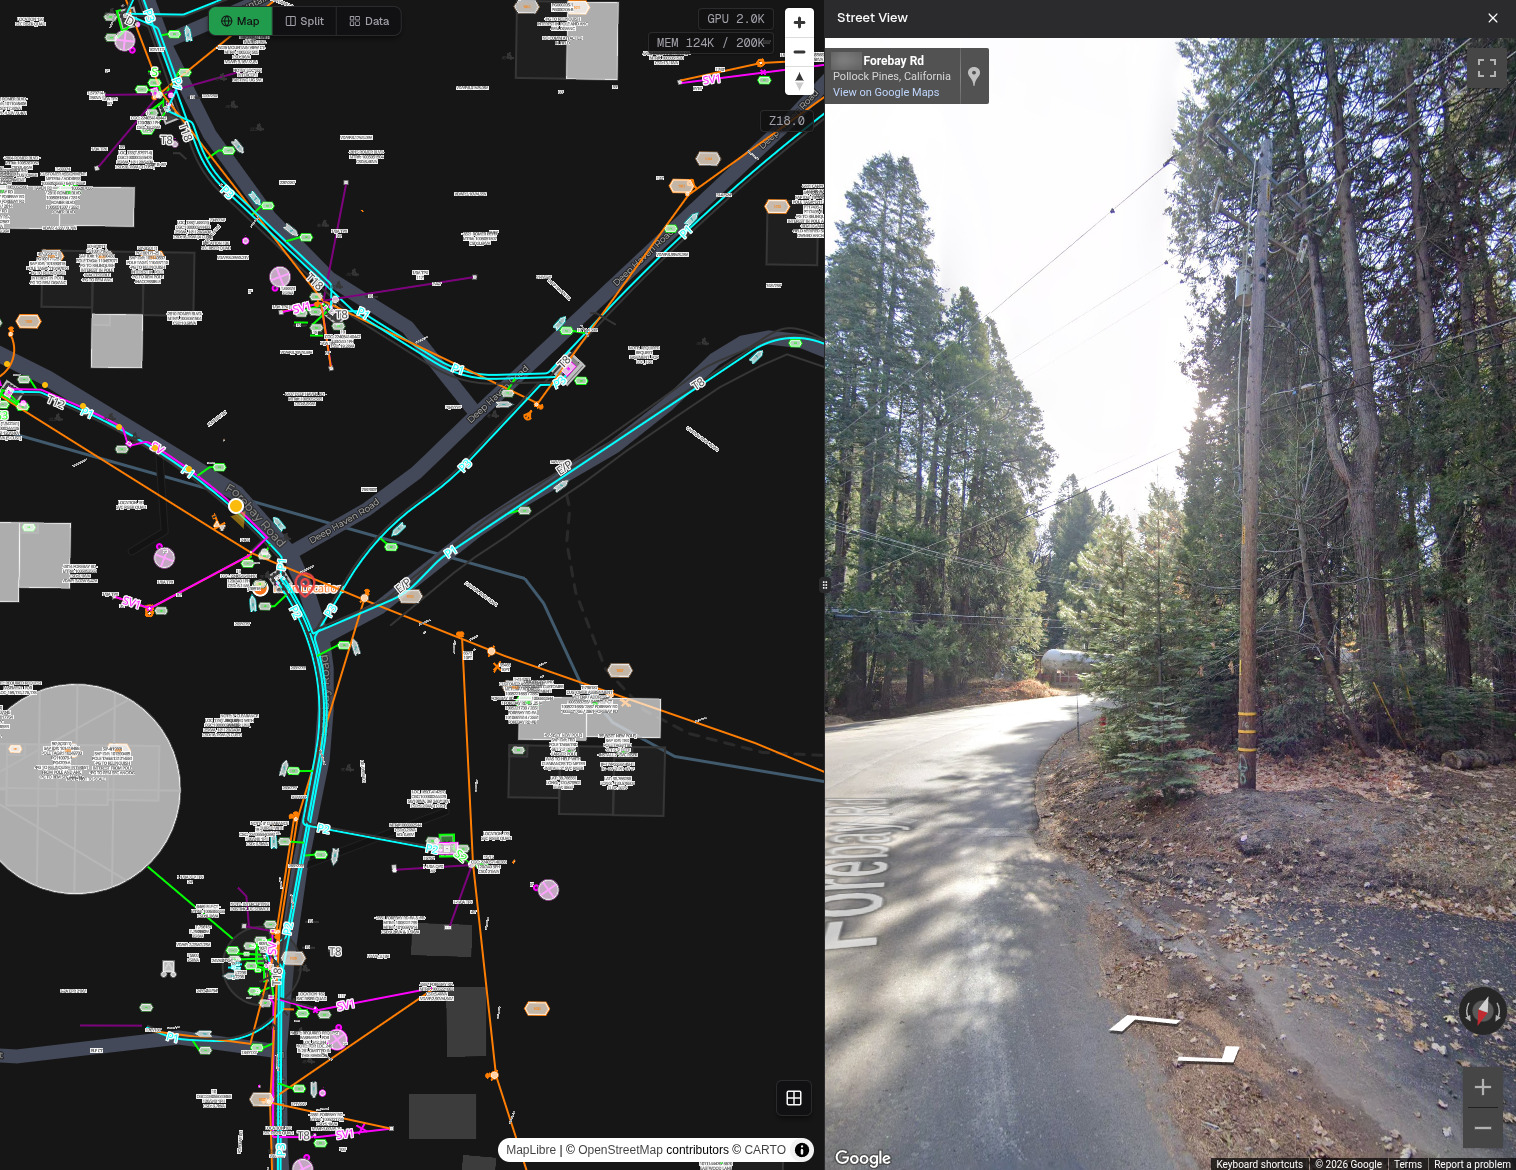
Field video keeps its GPS track, so you can walk the route from your desk. And Google Street View opens next to the drawing at the spot you click.
From the drawing to a number you can track.
Takeoff works on real coordinates, so lengths and areas are true without scale math. Dimensions become priced quantities, and quantities become progress the field logs as the work goes in.
- 1
Derive dimensions from the drawing
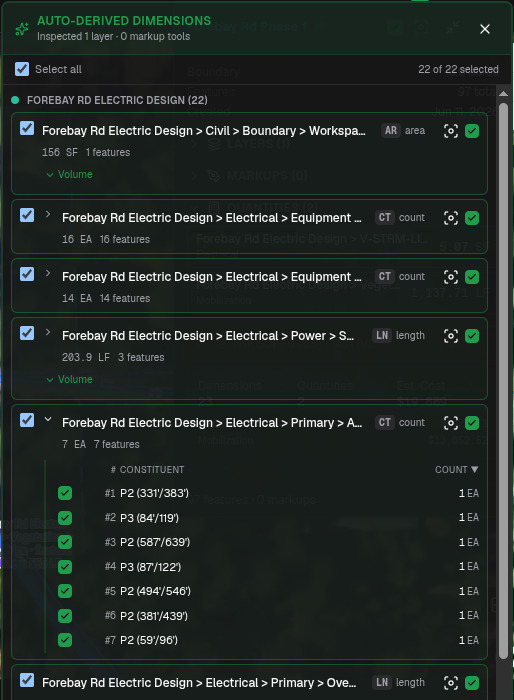
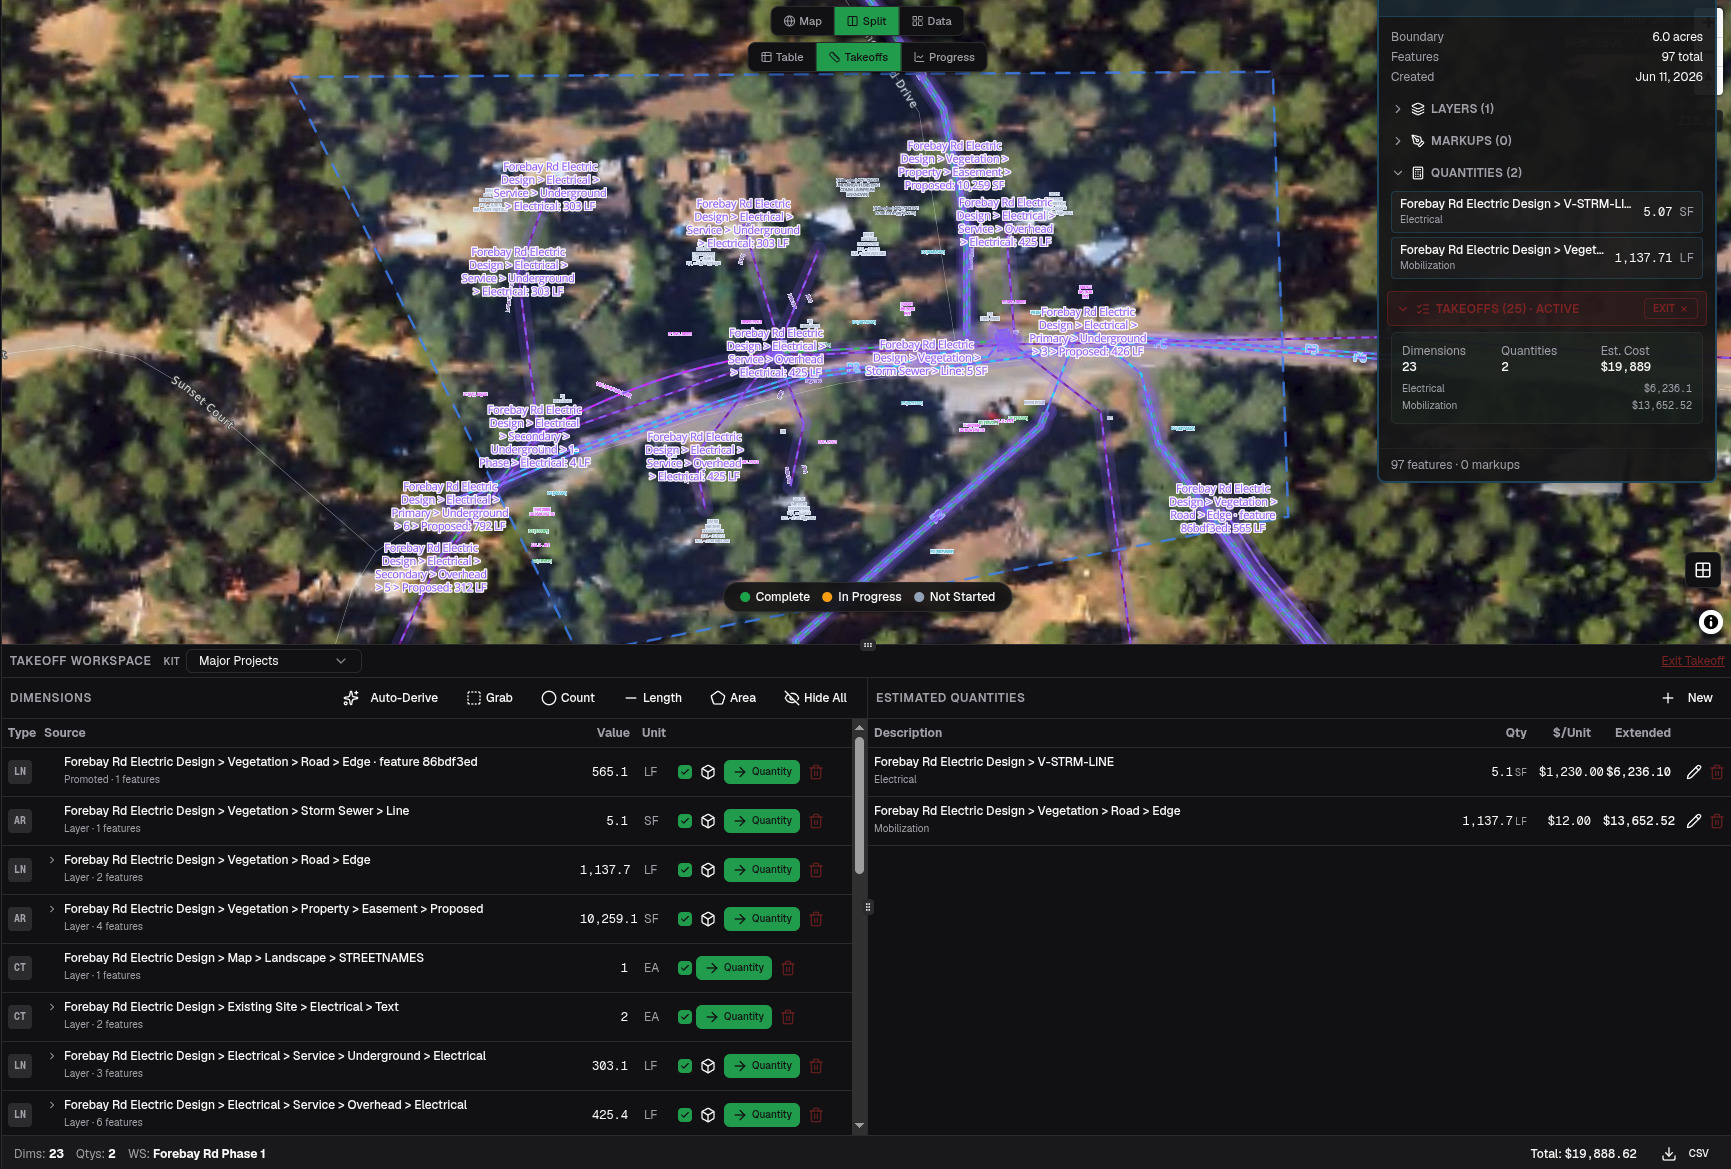
Auto-derive reads the layer hierarchy and proposes counts, lengths and areas for everything in the work set. Expand any row to see every feature it counted, and keep only what you want.
- 2
Turn them into priced quantities
Each dimension becomes a line item with a unit and a price. Dimensions on the left, estimated quantities on the right, the scope outlined on the map.
- 3
Log installed progress
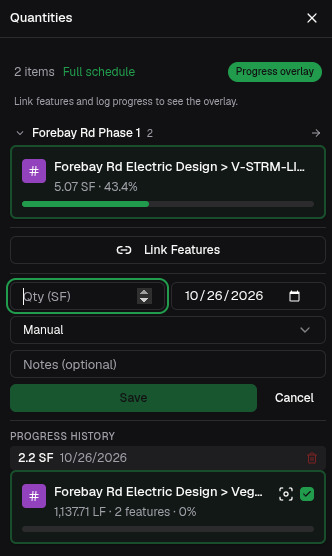
Crews record what went in against each line item, from the web or the phone, even offline. Progress shows on the map: complete, in progress, not started.
- Automatic and learned suggestions propose dimensions from layer structure and remember what your team enters.
- Quantity kits with line items, units and pricing, reused across jobs.
- Progress on the map, colored by line item: complete, in progress, not started.
Package the scope. Compare the options. Send it on.
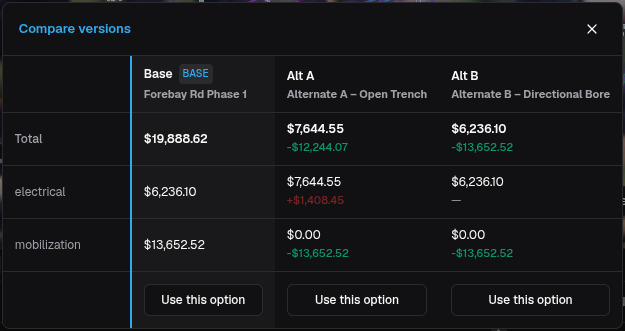
A work set is a saved selection of features and markups: a phase, a crossing, a change order. Keep a base and alternates, compare their cost side by side, and hand the winner to whoever needs it.
- Share a link that opens the exact view, layers and all.
- Export DXF with markups organized by kit and group, true colors and the projection file.
- GeoJSON and CSV for GIS teams and spreadsheets.
The map and the spreadsheet, finally in sync.
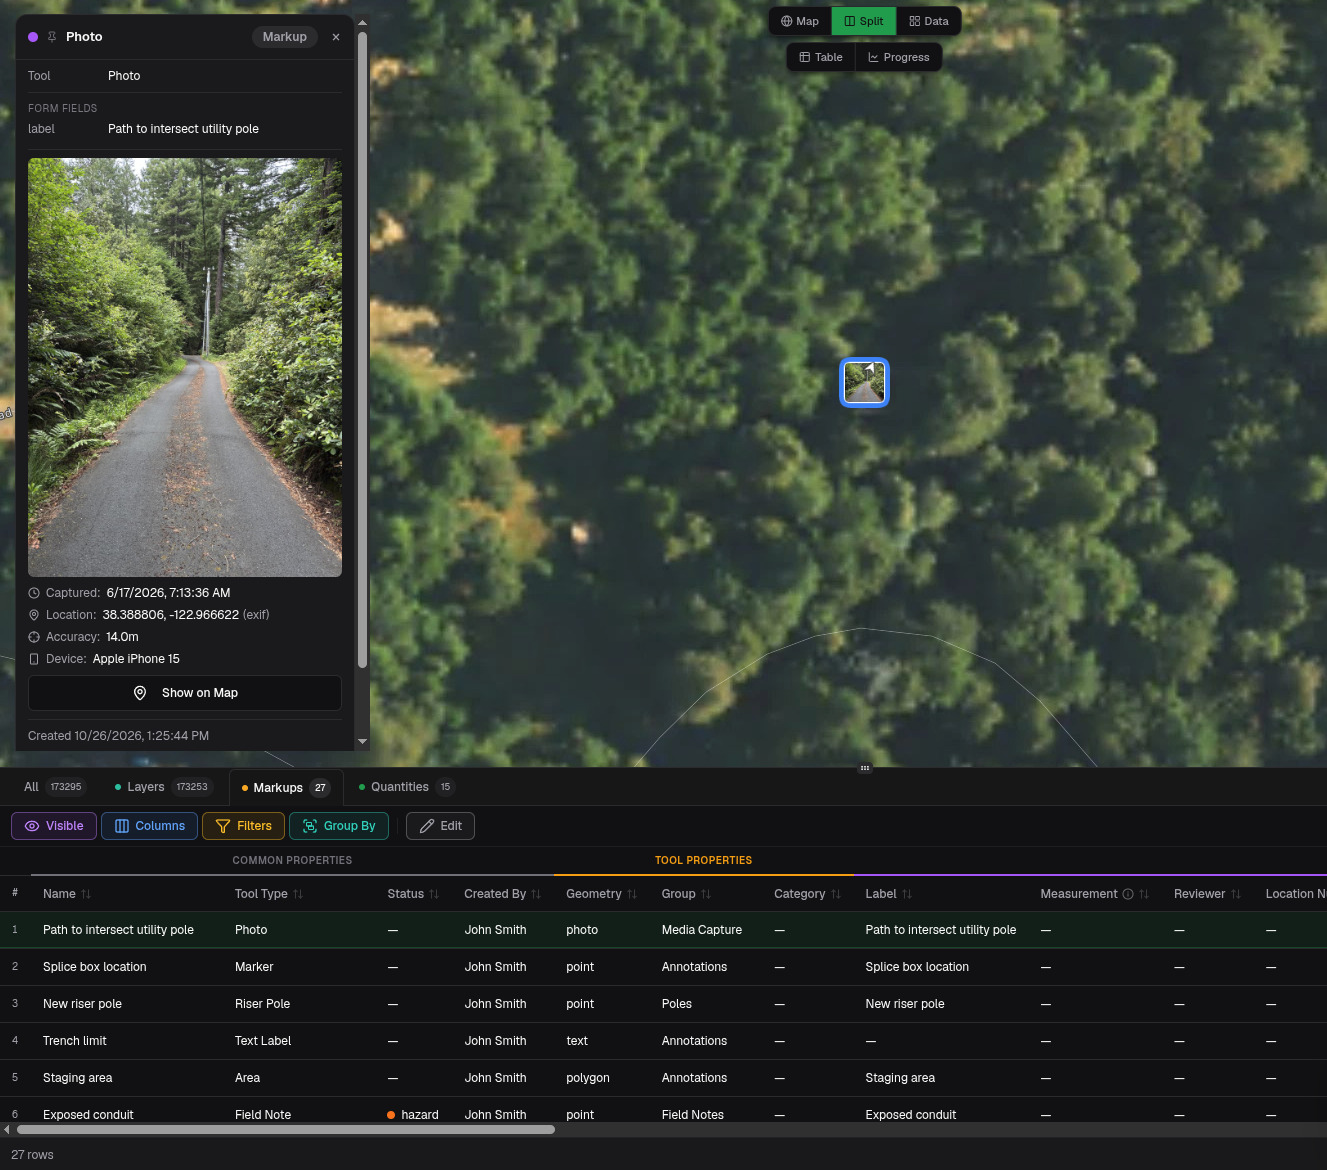
Split the screen into map and table. Select a row and the map zooms to it. Select on the map and the table follows. Filter and group by status, crew or type on both at once.
See it on your own drawings.
Upload one DWG or shapefile from a current job. It takes about five minutes to see your site on the map.